
With the rise of AI analytics, semantic layers have made a comeback in the data world. Over the last 18 months, investors have talked about the importance of data context for agents, Snowflake and Databricks launched native support for semantic modeling, and frontier labs have shared how they’re leveraging semantic layers and data context to build internal data agents.
Having spent most of my career building and using data applications and platforms (including semantic layers), I’m fascinated by the recent AI-led market, technology, and product innovations that have made semantic layers relevant again, and how quickly they’re transforming analytics workflows as a whole.
This post is a personal reflection on semantic layers, self-serve analytics, and analytics work in a post-AI world.
How a semantic layer works
A semantic layer is an abstraction that sits between a company’s source data and the people querying it. A data steward maintains source-of-truth definitions for metrics (e.g. revenue) and dimensions (e.g. time, product, customer) in configuration files. When an end user picks a set of metrics and filters – say, revenue by product over the last 30 days – the semantic layer translates this selection into the correct SQL, runs the query, and returns the result.
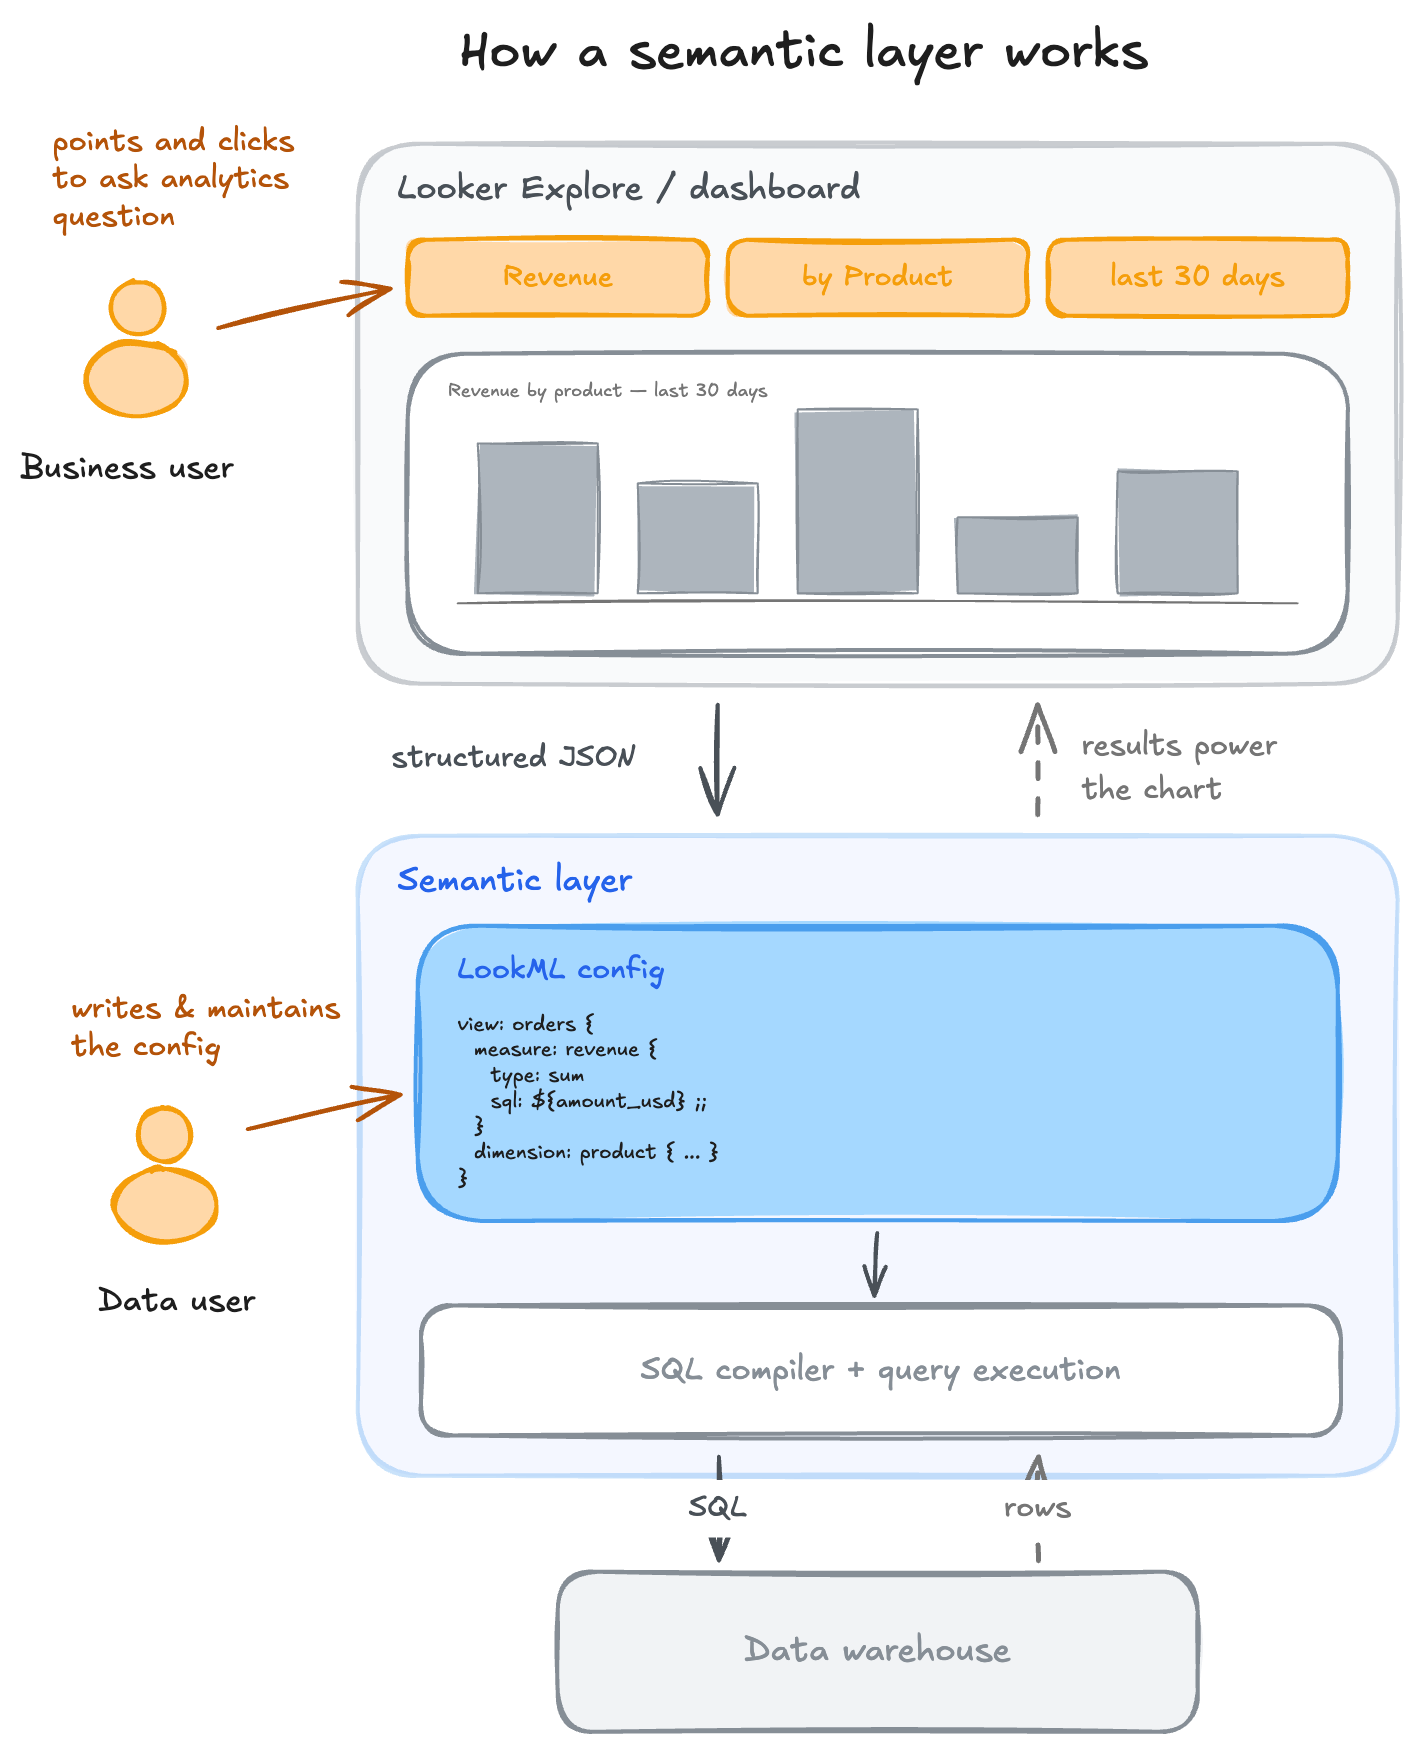
This provides two main benefits: data teams get a source of truth they can define and enforce for key business metrics, and non-technical teams get to “self-serve” their analytics questions without learning SQL or how the data is modeled.
Semantic layers have been around for a long time, but historically they were embedded inside BI tools, because that’s where most people consumed metrics – exploring and charting them visually. With a point-and-click UI, a non-technical user can answer “how much revenue did we make last week?” and build a dashboard in minutes.
Over the last decade, Looker has been the modern BI platform best known for its semantic layer and proprietary semantic modeling configuration language, LookML.1
The promise of the standalone semantic layer
Lyft was an early Looker customer and we believed that its semantic layer could unlock self-serve analytics for the company. After our data team made significant investments in LookML, we had hundreds of employees across the company using Looker every week to answer their data questions. But teams also felt limited by Looker, which supported basic metric filtering and grouping features but lacked the flexibility to handle more complex questions.
To unblock themselves, some ambitious marketers and operations folks ended up learning SQL and writing their own queries. Other teams built custom apps for monitoring market health by geography and other specialized use cases. Meanwhile, since LookML could only power queries from Looker, Lyft built another semantic layer to power the in-house product experimentation platform. As you might guess, this resulted in a huge amount of business logic duplication, inconsistency, and sprawl – which defeated the purpose of the LookML investment.
Other large tech companies at the time like Uber and Airbnb faced similar challenges and built standalone semantic layers as a solution. The core idea was to decouple the semantic layer from the BI tool and build it as a platform, extending its canonical metric definitions to power all of the interfaces teams used to consume data.
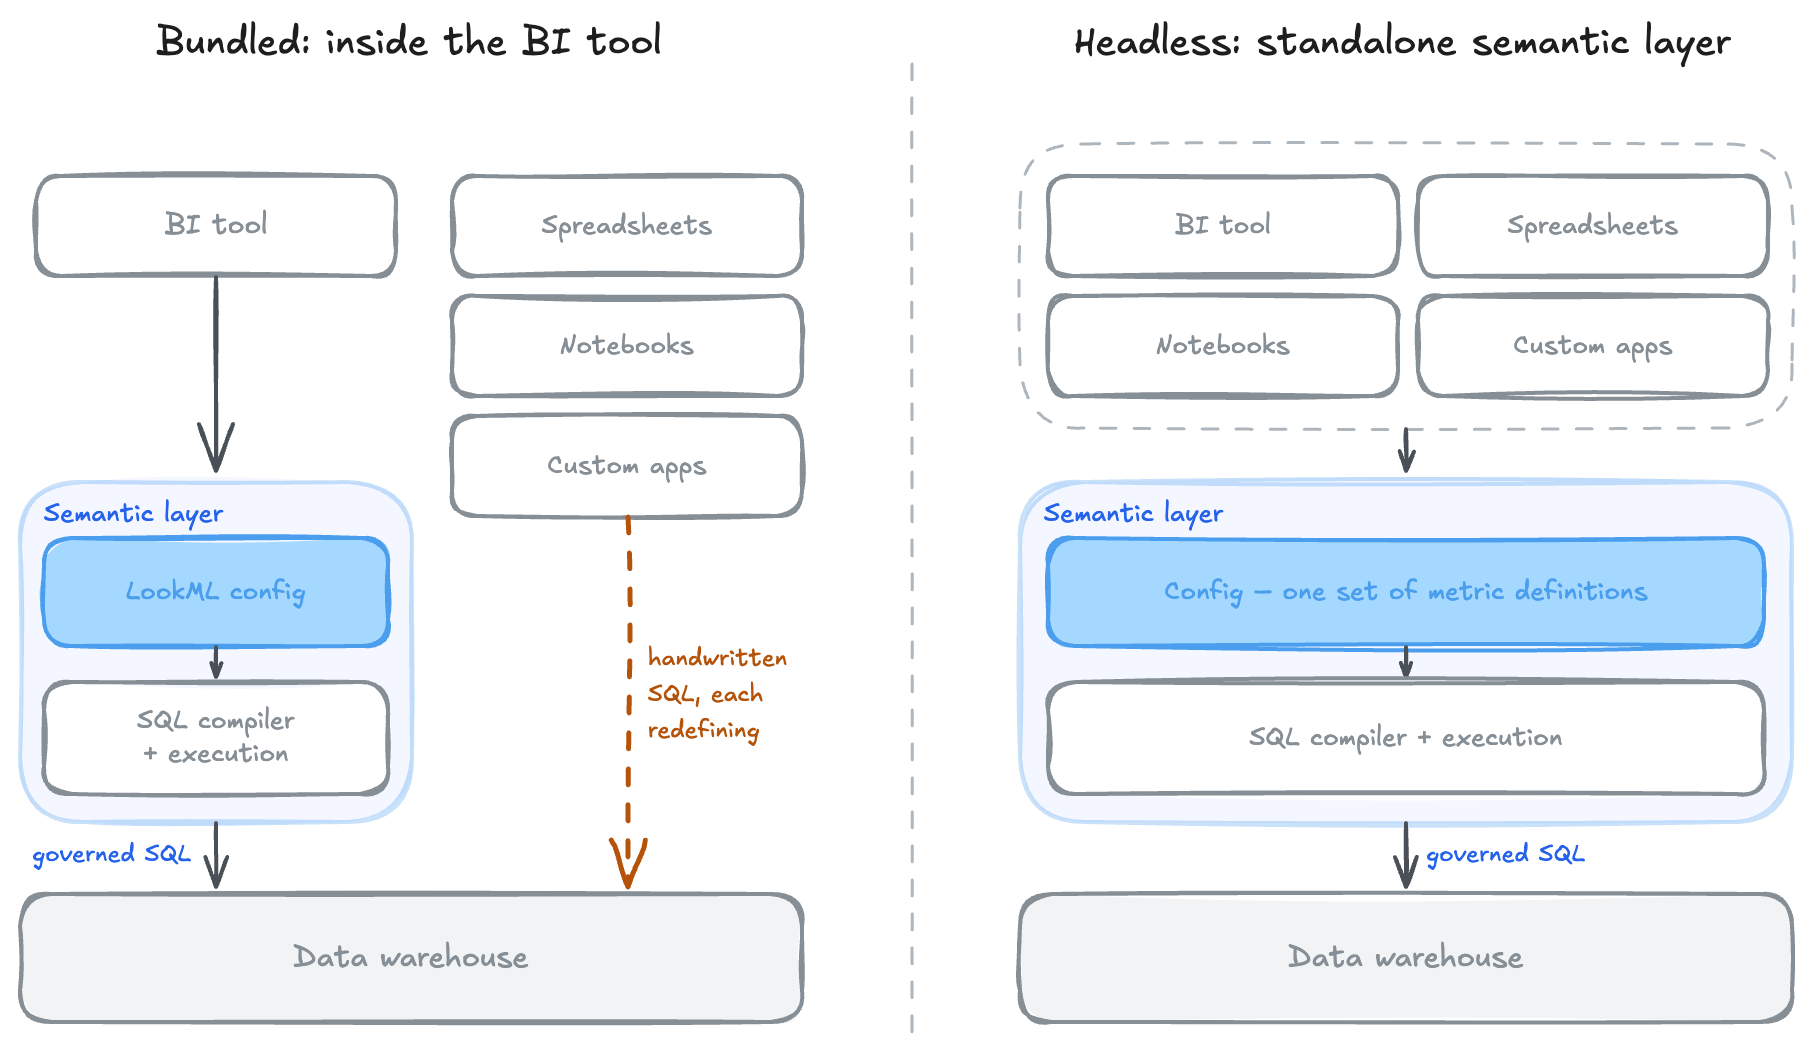
I founded a startup called Supergrain to solve the same problem for everyone else. We branded it headless BI, as it was similar in architecture to solutions like headless CMS and headless e-commerce. In the process, we learned that the market for standalone semantic layers was actually quite small. Most companies far enough along in their data journey to experience the pain of metrics inconsistency had already built their own solutions, and most smaller companies were trying to solve more foundational problems – like centralizing their data in cloud data warehouses or setting up analytical data models. They didn’t have a burning need for strong metrics consistency. We ended up pivoting, as did most of our competitors.
After the post-ZIRP crunch in 2022, enterprises cut budgets, which directly impacted data teams. The data software space consolidated as the industry shifted from best-of-breed tools to all-in-one platforms. After a brief moment in the spotlight, standalone semantic layers fell out of the data zeitgeist.2
The rise of text-to-SQL
Before LLMs, business users had two main ways to self-serve their analytics questions: use a point-and-click BI tool like Looker with a semantic layer (often too limiting), or write SQL by hand, which relied on knowledge of business definitions and data schemas (often too time-consuming to learn). Neither was a good option. For many, the most practical path was giving up on self-service altogether and asking a friendly data scientist for help.
LLMs broke down these barriers by unlocking the text-to-SQL product experience: business users could ask arbitrarily complex questions of their data by typing natural language into a chat box, hit enter, and get back syntactically correct SQL in seconds. Suddenly, people were no longer constrained by the limited interfaces of BI tools, their own ability to write SQL, or their access to human data scientists. Text-to-SQL was the elegant product solution to self-serve analytics that resolved the tension between flexibility and accessibility.3
However, many early text-to-SQL products generated semantically incorrect SQL and produced wrong answers to questions. Despite the queries running successfully and appearing correct, they often missed a key filter or table join. Unlike problems with hallucinated data fields and table names which threw errors, nuanced semantic issues were hard to catch without a trained eye and created a false sense of security for the people least familiar with the data model (ironically, non-technical users with the most to gain from text-to-SQL).
This problem played out with Stripe’s Sigma Assistant, a text-to-SQL product feature that lets users query their Stripe data using natural language via a chatbot. The company has very specific business logic for calculating revenue and subscriber metrics, but because these definitions were not properly encoded, the chatbot returned inconsistent numbers depending on how users asked the questions.4
Text-to-SQL was clearly a superior product UX to handcrafting SQL or pinging a data scientist, but it also introduced new technical challenges that required a different architectural approach. Unlike point-and-click dashboards, which could be (and often were) powered by hardcoded queries, chat interfaces exploded the input question space and made this approach unscalable. And the LLMs at the core of the product needed access to semantic layers with canonical metric definitions to deliver correct results reliably and consistently.
Analytics workflows, redefined
Text-to-SQL might have been the killer use case semantic layer builders were waiting for, but it was also a harbinger of much bigger changes to the broader analytics workflow. From a jobs-to-be-done (JTBD) perspective, AI replaced or augmented a lot of the jobs previously owned by humans.
First, AI replaced a lot of translation work that semantic layers performed. BI tools that previously passed end user input as structured JSON (e.g. metric: revenue, dimension: product) to semantic layers could pass questions in English to LLMs that interpret natural language directly. Deterministic templating engines (with adapters per database) that previously compiled those JSON inputs into SQL were replaced by LLMs that natively write fluent SQL in any dialect. And query execution moved from a fixed request-response service into the AI agent, which runs SQL via tool calls to the data warehouse as needed.
Second, AI absorbed reasoning tasks previously done by human data scientists. These include breaking down multi-step analyses into component parts, gathering and synthesizing relevant business context (from internal docs, GitHub, or Slack), and drafting final write-ups and decks.
Third, AI widened the path governed by business and metric definitions. In the old world, semantic layers could only handle relatively simple operations such as filtering and grouping predefined metrics. Anything more complex circumvented the semantic layer (and contributed to business logic duplication and inconsistency): humans translated the questions, wrote SQL by hand, and executed queries themselves. With LLMs able to understand arbitrary natural language, a much greater share of real analytics workloads can flow through the governed path.5
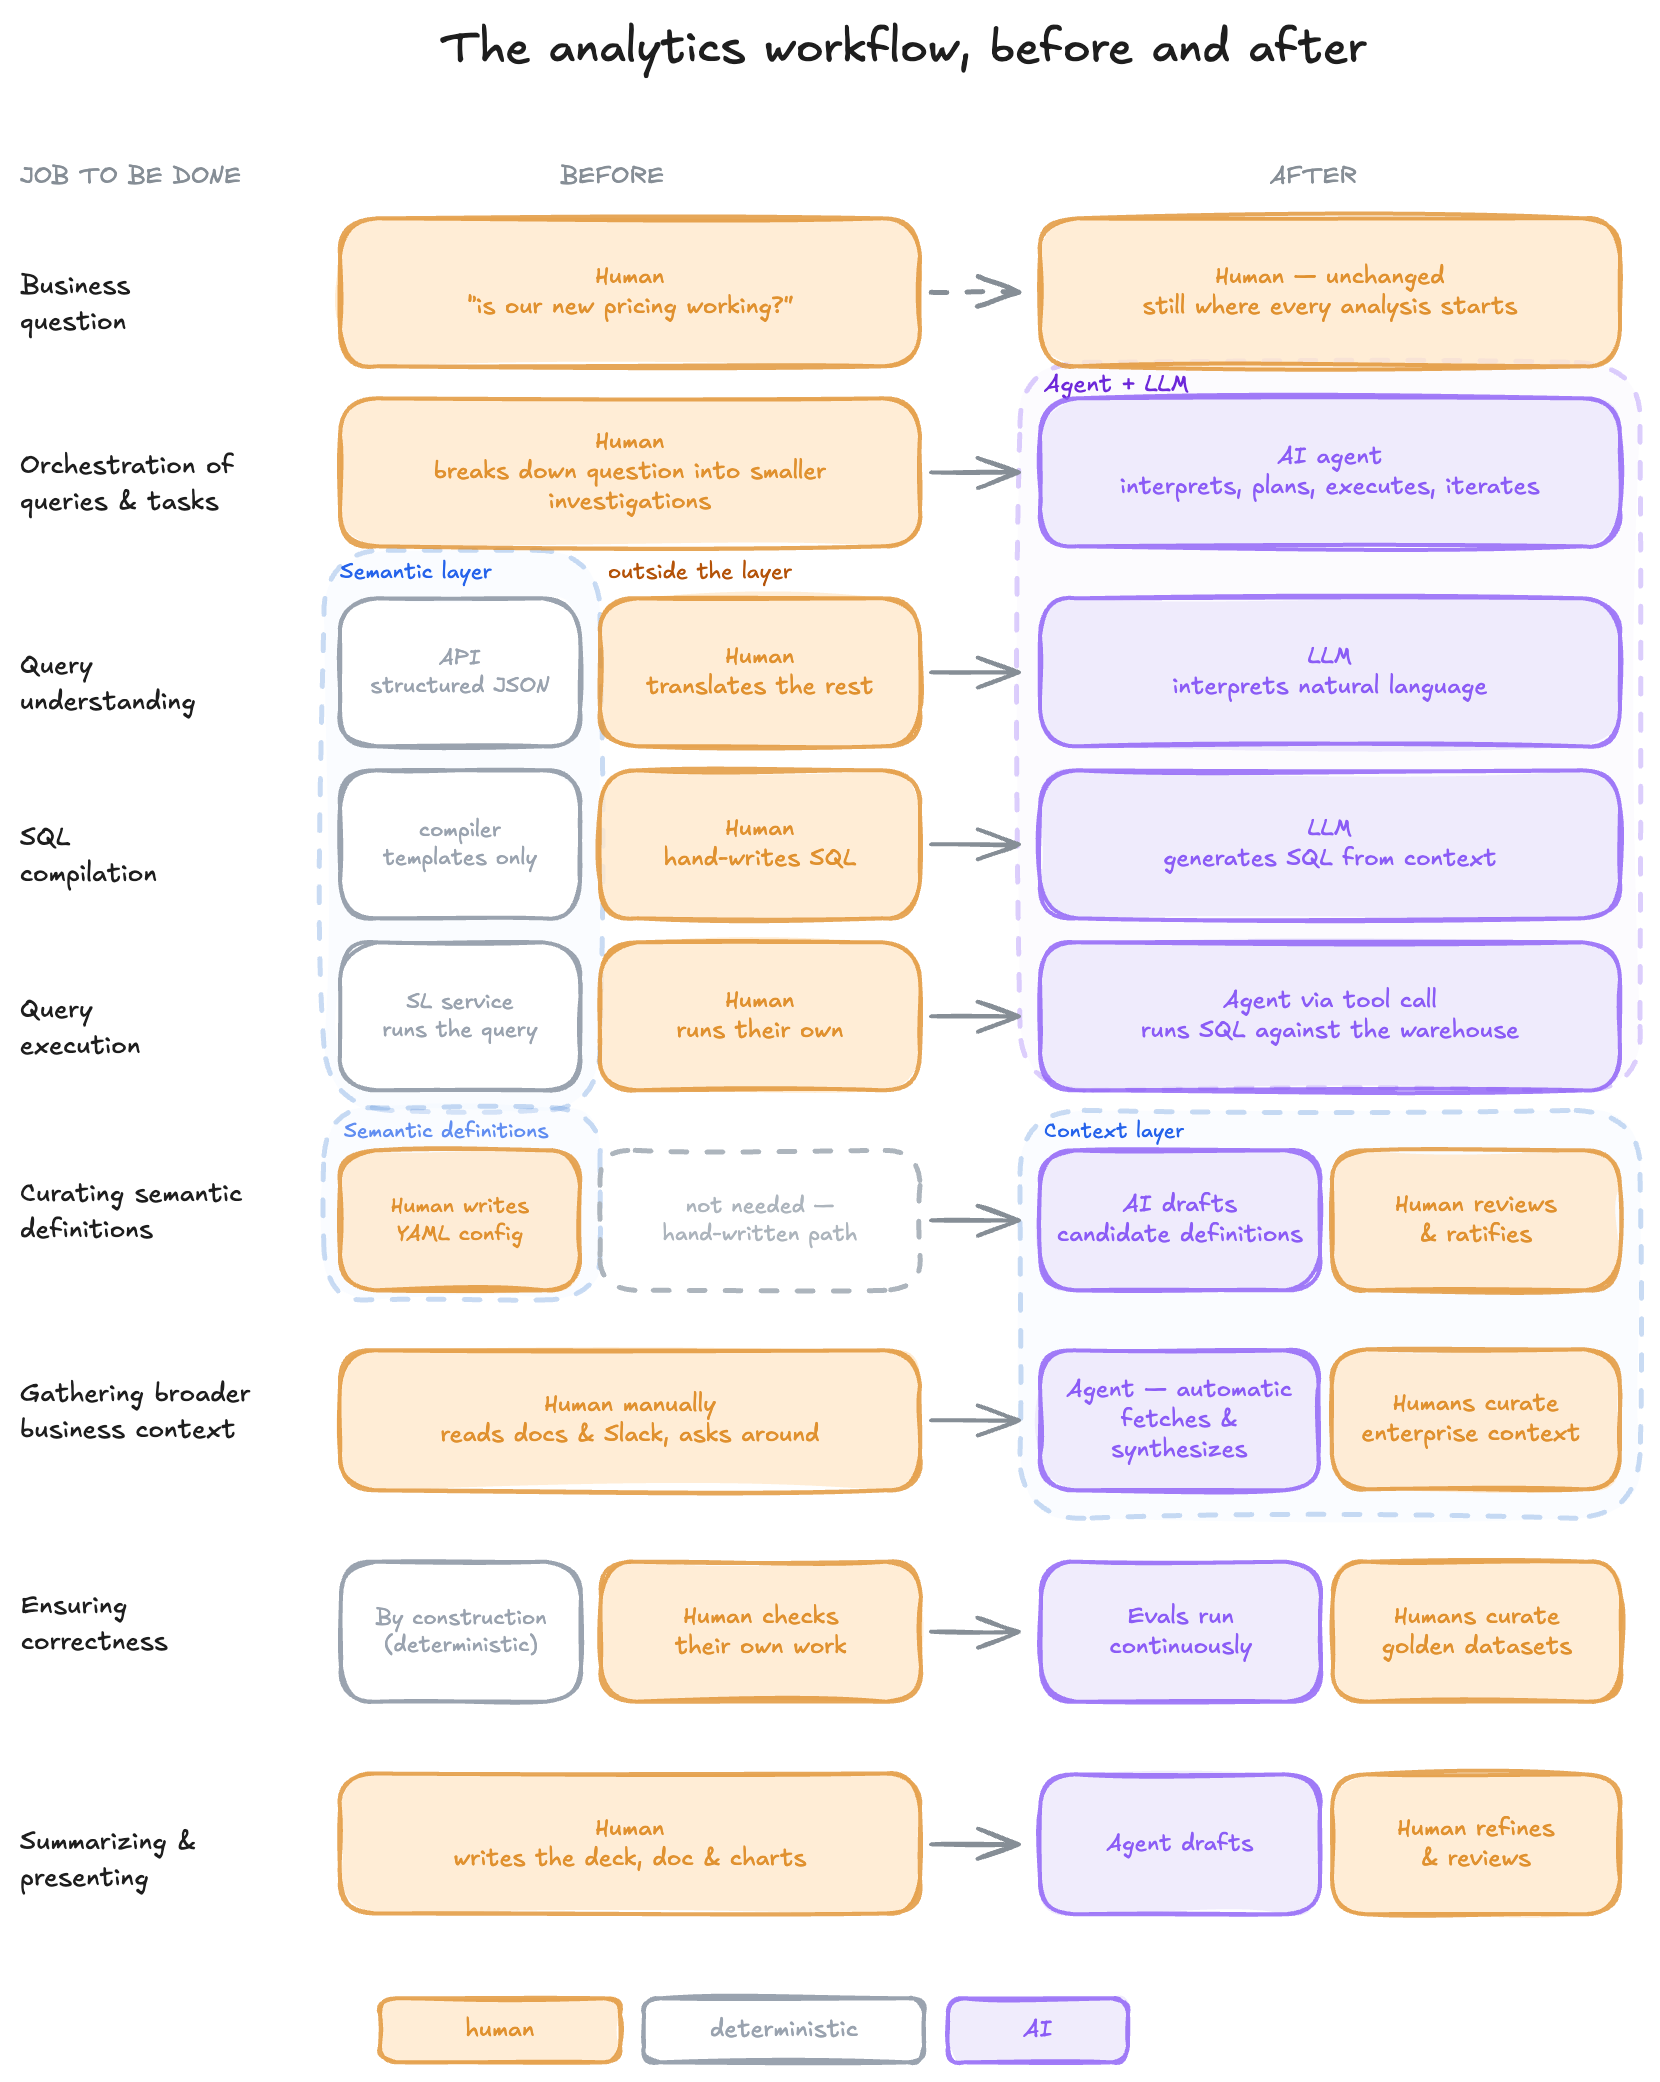
From a systems perspective, of the original semantic layer components (metric definitions, metrics API, SQL compiler, query execution), only metric definitions survive in a post-AI world. Even so, the implementation of definitions has evolved to include previously inaccessible elements: instead of being encoded in pure YAML or LookML, definitions can live inside a plain markdown file that mixes YAML with sample SQL queries and business rules written in English.6 LLMs give us unparalleled expressiveness to encode business semantics (including data nuances and edge cases) in formats not possible before.
Generating the definitions has also never been easier. Historically, the big challenge with implementing semantic layers was the cost of the upfront semantic modeling work: few teams (mine at Lyft included) enjoy writing LookML, which is why many companies struggled to build good coverage and maintain up-to-date definitions. Today, any AI agent pointed at a data warehouse is capable of generating metrics definitions from the schema and query history alone. Given access to Slack, meeting notes, and internal wikis, they will incorporate additional context from those sources and produce passable markdown files.
The one key job that didn't exist in a pre-AI world is ensuring correctness. Because semantic layers compiled SQL deterministically, vetted metric definitions guaranteed correct queries – and anything outside the governed path was implicitly reviewed by the humans who wrote it. Since LLMs are probabilistic models, analytics agents require evals and verification loops to help both builders and users understand and measure performance. At a minimum, this requires curated question-and-answer pairs for representative business questions (e.g. “what was revenue in Q1 2026?” → USD 27.54 million), run continuously to measure how changes to definitions, business context, or the underlying models affect performance. At Stripe, we relied heavily on evals to identify issues and improve our text-to-SQL product experiences (both user-facing and internal) over time.
So where does all this leave us? Is the semantic layer dead? Some data vendors have repositioned around the context layer, a term for the logical grouping of semantic data definitions and general enterprise context. I don’t know which labels will end up sticking, but what’s clear is that AI has decomposed the traditional analytics workflow – and redefined it around a much more flexible, probabilistic core. Agentic systems can operate over far more business semantics and context than config files could ever hold, make better use of both, and answer a much wider range of questions – all through a single governed path that's easier to maintain than before. And in this world, semantics, context, and verification are critical.
The quest for self-serve analytics
Asking business questions in English via chat was the initial AI form factor, but state-of-the-art AI analytics systems have advanced significantly to accomplish far more. We can visualize this by organizing analytics work on a hierarchy of complexity, with basic reporting tasks at the bottom and strategic business and product recommendations at the top. The higher a task is on the pyramid, the more judgment it requires. As AI systems improve to handle these higher-order problems, more analytics work becomes self-serviceable.
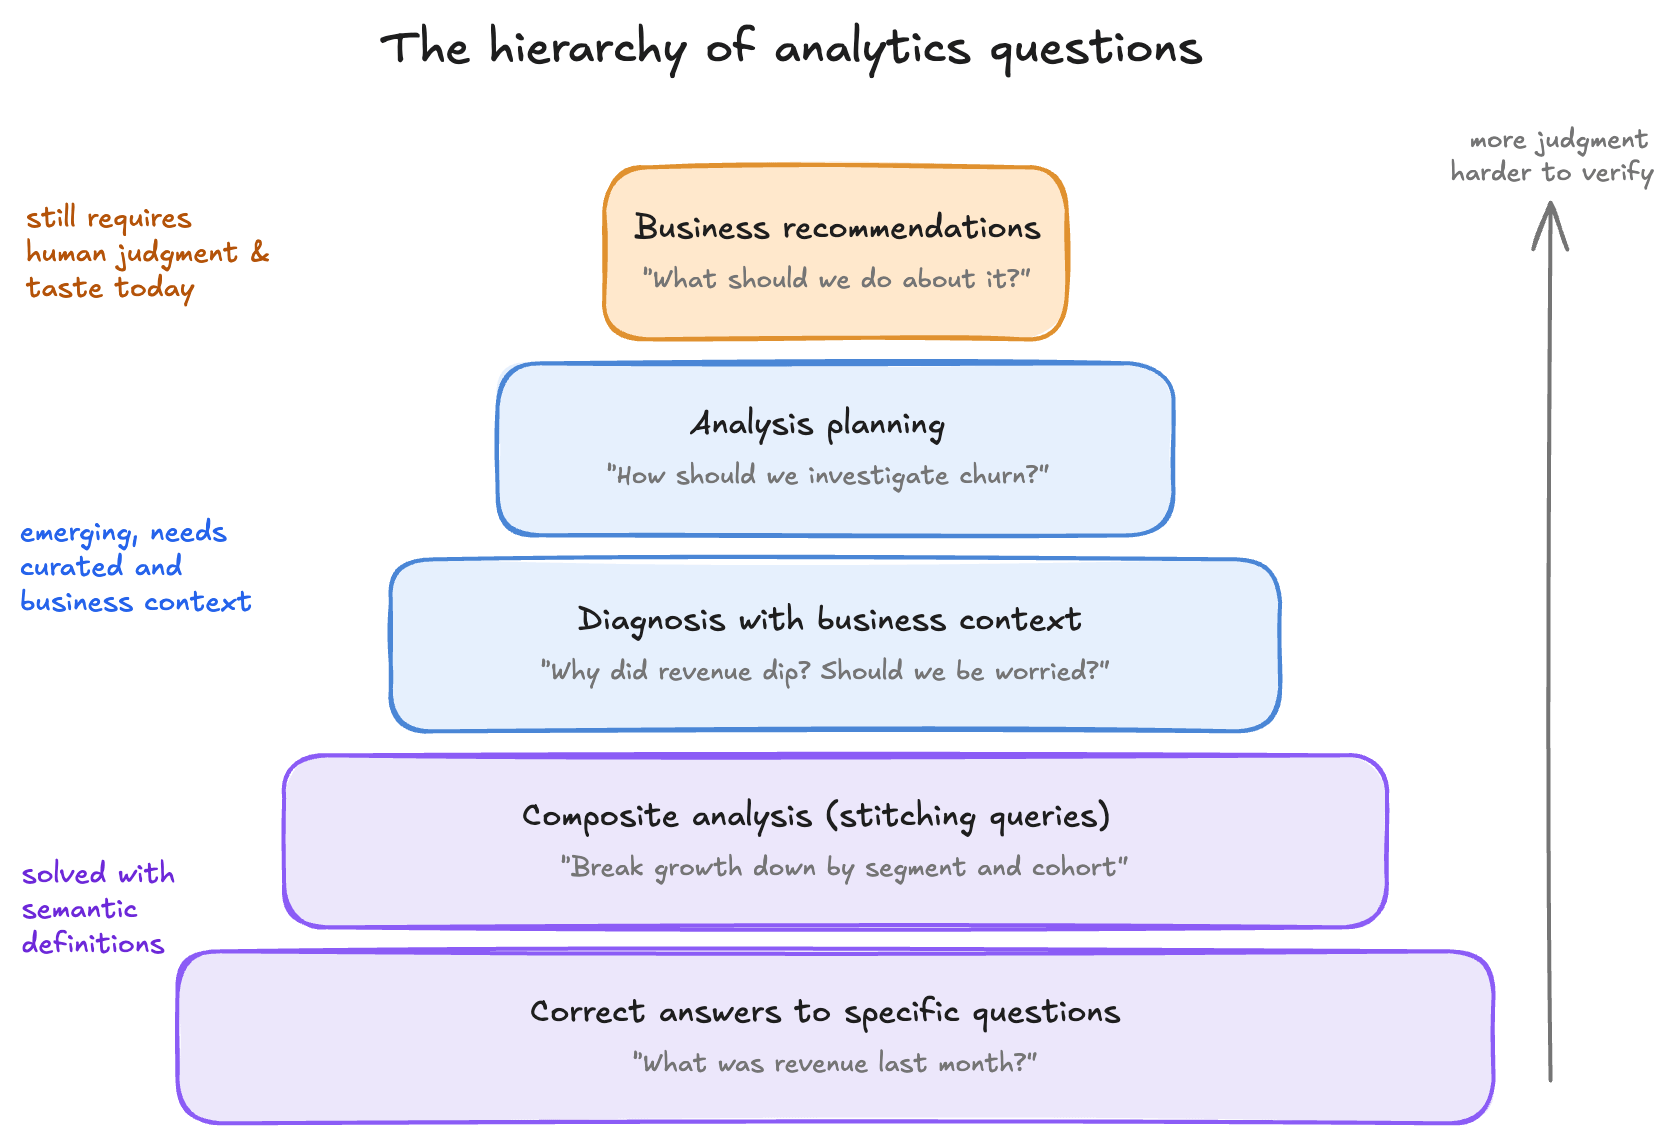
Today, the bottom of the pyramid is largely solved. With the right semantic information, business context, and evaluation criteria, analytics agents reliably answer one-off questions and composite analyses like customer segmentation and cohort analysis – as OpenAI’s and Anthropic’s data teams have shown. We’ve seen similar results with Stripe’s internal analytics agent, which had access to canonical metric definitions, a skill library, and enterprise data sources.
The middle of the pyramid is the current frontier. Analytics agents can run autonomously for hours – breaking down ambiguous problems, reasoning across business context from disparate sources, and executing dozens of analytics tasks in parallel. I’ve seen examples of agents successfully executing higher-order analyses like root cause diagnostics that require judgment, especially when given clear constraints and instructions (e.g. via skills).
At the top of the pyramid are key recommendations and findings that drive business-critical decisions. For example, product roadmap prioritization or a large pricing change that affects many customers. Historically, these have relied heavily on human taste and judgment. Analytics agents today can generate first drafts and assist human data scientists with end deliverables, but we’re not yet ready to accept or act on AI-generated analyses and business recommendations – without human review when the stakes are high.
How we get there
I don’t know how far we are today from fully self-serve analytics workflows, but better mechanisms and tools for context curation and verification of higher-order work would bring us much closer.
Curating high-quality context is important for agent performance, but not all context is the same. Context curation is relatively easy for certain types of artifacts like schemas, query history, and pipeline code that are already well-organized and version-controlled. But they mostly serve tasks at the bottom of the analytics pyramid. Higher-order analytics questions often rely on product strategy docs, Slack threads, and meeting notes – high-entropy information that can be difficult to govern (if it even exists digitally). Today, human data scientists bridge the gap, carrying context in their heads and injecting their judgment across the analytics workflow. For agents to do higher-level analytics work, this unstructured context needs to be captured, curated, and maintained more systematically.
Text-to-SQL is easy to evaluate because SQL is executable and therefore verifiable: it’s straightforward to run a generated query and compare its results against a golden answer. Verification is harder for higher-order work. There is no objective answer for an investigation into why revenue dipped and what the business should do about it – data scientists apply layers of judgment throughout, and an analysis can be faulty even when every individual step checks out. Making complex analyses truly self-serve for business users requires better ways to systematically evaluate the higher-order work that data scientists actually produce.
Many organizations are already making progress on context curation and verification. Here are some of the strategies I see being deployed:
Shared skills and plugins. Package analytics workflows and business context into reusable skills and plugins. Agent skills teach agents best practices and behaviors, while distributing tools to non-technical data consumers across an organization. Many analytics workflows like diagnosing a metric drop or producing a weekly metrics readout follow a specific playbook that can be easily documented and shared via an internal GitHub repository.
Curator agents. Much of what we call tribal knowledge does not strictly live in people’s heads. In many cases, it’s fragmented across unstructured data sources that only a handful of subject matter experts can find and make sense of. Organizations can deploy curator agents across Slack, Google Docs, GitHub, and SaaS tools to scan for contradictions, stale content, and gaps. Detected issues are routed to appropriate human owners for review, similar to the way CODEOWNERS files help route code changes to the appropriate reviewers in software engineering workflows.
Analysis-based evaluations. At Lyft, our data science interview process included a take-home assignment where each candidate submission was graded anonymously by two reviewers, based on a standard rubric. To ensure grading consistency, we tracked reviewer grades and recalibrated anyone who deviated too far from the rest of the rotation. Teams can use a similar approach to design analysis-based evals that verify higher-order analytics work. Grader agents apply the analysis rubric, while human data scientists work to align the grader agents until they can assess analyses as effectively as human reviewers can.
Ambient capture of decisions. As more knowledge work flows through agents, each agent run can be programmed to emit a decision trace automatically: what inputs were gathered, what policies and intermediate judgments were applied, what alternatives were considered, which humans provided input, etc. Foundation Capital calls the accumulated result a context graph. Unlike humans who cannot reasonably be expected to create detailed audit logs for each task, language models generate this metadata at scale. When combined with human context curation, ambient capture creates a compounding flywheel that can significantly improve the quality and completeness of enterprise context.
Rebalancing human work. As we shift to a world where agents are doing the most time-consuming analytics jobs, what do humans do with their newfound time? One possibility is that data scientists shift to focusing on analysis review, skill creation, and context curation to improve agent performance and optimize verification loops. In software engineering, senior engineers routinely spend significant time reviewing code with dedicated tools (CI automation, GitHub, etc.). Perhaps we’ll see a similar rebalancing of human work in data science, where reviewing analyses and building playbooks become more explicit, first-class responsibilities with their own toolkits.
Of course, this is by no means an exhaustive list. I expect the shape of the problems and solutions to continue evolving as the technology advances.
Enabling data-driven organizations
Building a data-driven organization used to require significant investments in data software, infrastructure, and talent that only big tech companies like Lyft could afford. In the last decade, the emergence and adoption of the modern data stack helped startups and small teams leverage those same technologies. But semantic layers remained too difficult to implement and achieving the holy grail of self-serve analytics didn’t feel any closer than it did when I started my career.
Over the last couple years, AI has moved self-service analytics further than anything since the invention of the OLAP cube, while reducing the cost for technical and data teams to a relatively small investment in business semantics, context curation, and verification.Meanwhile, empowering business users to self-serve their way to the top of the analytics pyramid now feels like an attainable near to medium-term goal.7 For someone passionate about building data-driven organizations, this is the future I’m most excited about and hope that AI and the data community bring to fruition.
While LookML is the most well-known semantic modeling language, there are many others, including Power BI’s TMDL and ThoughtSpot’s TML.
During this period, semantic layers did get absorbed into other parts of the data stack. For example, dbt Labs acquired the standalone semantic layer company Transform and integrated their semantic layer, MetricFlow. Snowflake built native support for semantic objects into the storage layer. The BI platform Hex lets you import a semantic model from a third-party semantic layer.
It’s worth mentioning text-to-SQL was not a new idea. Notably, ThoughtSpot was a pioneer of the “conversational analytics” category. Their demo of typing a question in English into a search box and getting an answer in seconds felt magical in a pre-LLM world.
In fact, one of the first things I worked on at Stripe was resolving discrepancies with MRR (monthly recurring revenue), an endless source of user confusion. I’m happy to report the company’s made a lot of progress over the last couple years (including investments in a semantic layer)!
There’s a certain irony for those of us who worked on standalone semantic layers, where the goal was to get every analytics workload flowing through a single governed semantic layer. AI essentially achieved it as a side effect, by becoming the single dominant interface that every analytics workload passes through.
a16z has a good illustrative markdown file in their blogpost.
While teaching a cohort-based online course called AI-Powered Product Analytics aimed at non-data scientists seeking to improve their data literacy, I’ve seen each successive class leverage AI to complete homework assignments better and faster.
Love hearing about your experiences working with these! I always hated writing lookML haha